Plot Utilities
Plotting # of identifications vs q-values
As discussed in the quickstart, # identifications vs q-value plots are available after installation by calling proteoTorchPlot. Options include
--output: Output file name where the figure will be stored. Default = figure.png
--maxq: Maximum q-value to plot to: 0 < q <= 1.0. Default = 0.1
--tdc: Perform target-decoy competition (true/false). Default = true
--dataset: PIN process which was analyze (only necessary if tdc = true).
--writeTdcResults: Write the results of TDC for all methods to new files (true/false). Default = false
--tdcOutputDir: Output directory to write TDC competition results. Default = ‘’
--publish: Apply plot settings from ProteoTorch paper (true/false). Default = false
Furhter details are available in the source, module proteoTorch.plotQvals.
Specifying PSM score files
General tab-delimited files are passed to proteoTorchPlot as triples method:score header field:PSM file, where method specifies the legend name, score header field specifies the header column name to use as PSM scores, and PSM file is the tab-delimited file name. The input file must contain header fields:
score header field - column of PSM scores to compute q-values with
PSMId - unique PSM IDs used in the analyzed PIN file
Label - whether a PSM is a target (1) or decoy (-1)
If target and decoy results are separated into two tab-delimited files, these may be passed in as the a quartet method: header field:target file: decoy file. In this case, the column Label does not need to be specified.
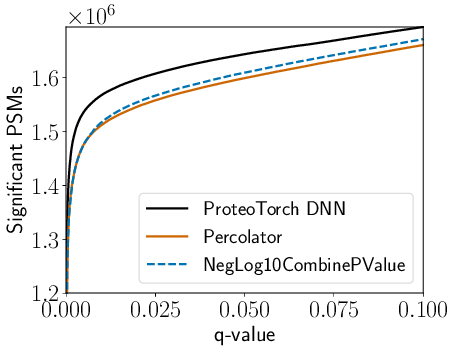
As an example, the following plots ProteoTorch and Percolator recalibrated scores for PSMs collected searching a draft of the human proteome dataset using the recently developed high-res MS2 p-value score function, residue-evidence combined p-value:
proteoTorchPlot --output kim_resev.png --maxq 0.1  \
    --tdc true --dataset kim_resev.pin --publish true \
    "ProteoTorch DNN":"score":output_dir/output.txt \
    "Percolator":'score':kim_resev_percolator.targets.txt:kim_resev_percolator.decoys.txt \
    "NegLog10CombinePValue":'NegLog10CombinePValue':kim_resev.pin
resulting in the plot below.
Note that, when TDC is specified, ProteoTorch generally uses the unique keys in header column PSMId to map PSMs to the (experimental mass, scan number) pairs specified in the original PIN file. However, if method is specified as one of {‘PeptideProphet’, ‘Scavager’, ‘q-ranker’}, it is assumed that experimental mass and scan number are explicitly provided (with respective header fields ExpMass and ScanNr) due to potential nonconformity of the supplied PSMId with these methods.
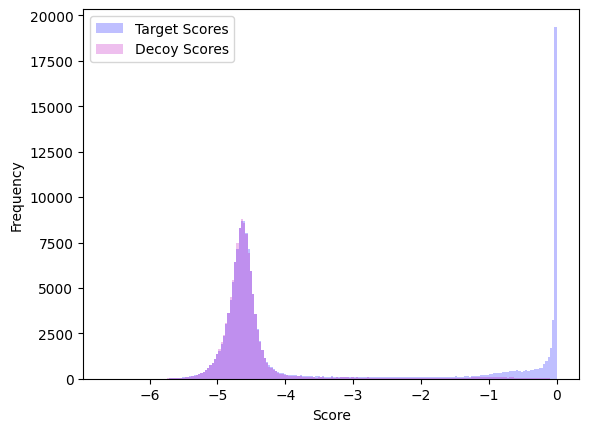
Histograms
The following python script shows how to import proteoTorch plotting tools to quickly create a plot of recalibrated target and decoy scores. PSMs were originally collected searching a dataset of SARS-CoV-2 Proteins collected from COVID-19 patiens using the Comet search engine:
from math import log
from proteoTorch.plotQvals import load_pin_scores, histogram

filename= 'output_dir/output.txt'
scoreKey = 'score'

# load ProteoTorch output
scores, labels, _ = load_pin_scores(filename, scoreKey)

targets = [log(s) for s,l in zip(scores, labels) if l == 1]
decoys = [log(s) for s,l in zip(scores, labels) if l == -1]

output = 'ihling_comet_proteoTorchDnn_hist.png'

histogram(targets, decoys, output, bins = 200)
which generates the plot below.